

Table of Links
3.1. Benefits scale with model size and 3.2. Faster inference
3.3. Learning global patterns with multi-byte prediction and 3.4. Searching for the optimal n
3.5. Training for multiple epochs and 3.6. Finetuning multi-token predictors
3.7. Multi-token prediction on natural language
4. Ablations on synthetic data and 4.1. Induction capability
5. Why does it work? Some speculation and 5.1. Lookahead reinforces choice points
5.2. Information-theoretic argument
7. Conclusion, Impact statement, Environmental impact, Acknowledgements, and References
A. Additional results on self-speculative decoding
E. Additional results on model scaling behavior
F. Details on CodeContests finetuning
G. Additional results on natural language benchmarks
H. Additional results on abstractive text summarization
I. Additional results on mathematical reasoning in natural language
J. Additional results on induction learning
K. Additional results on algorithmic reasoning
L. Additional intuitions on multi-token prediction
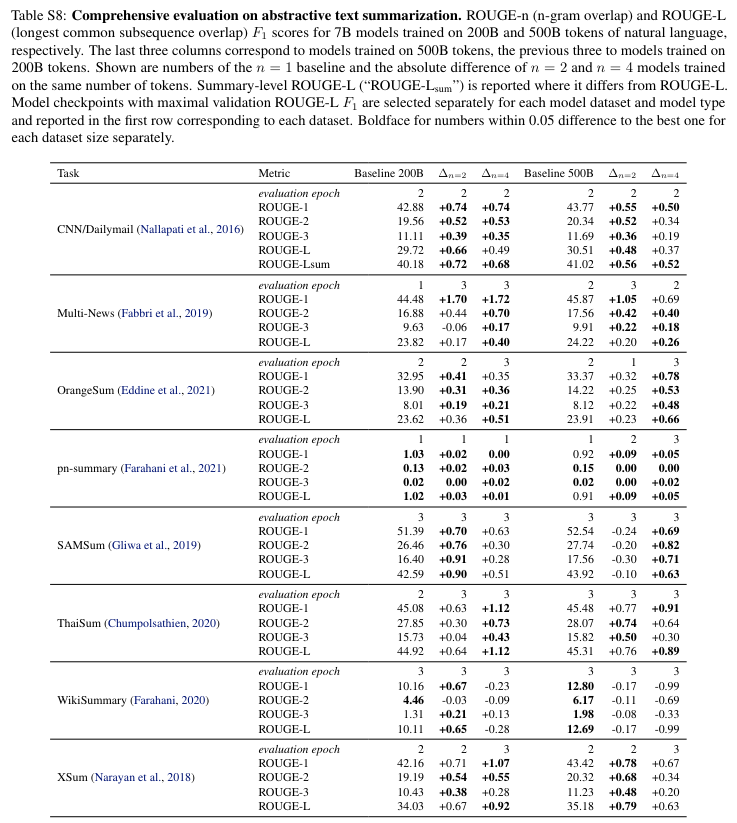
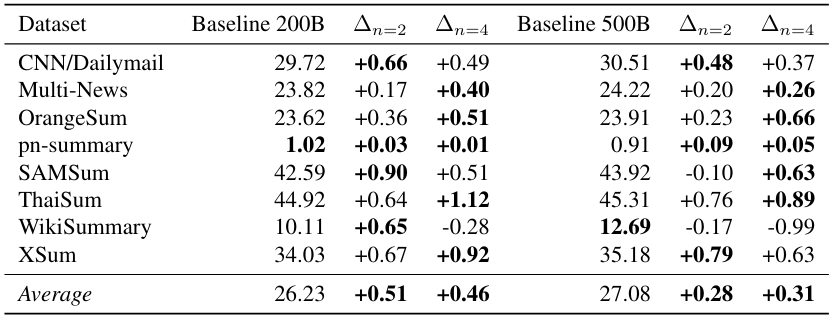
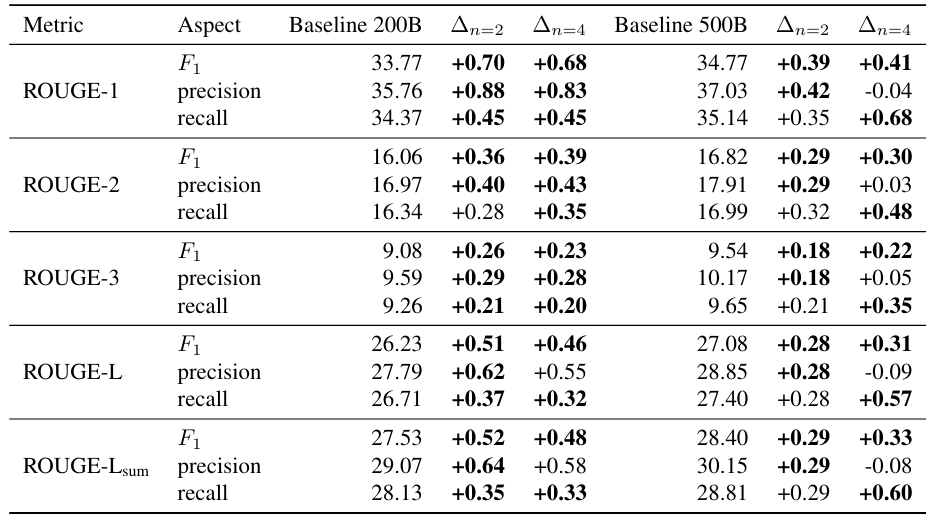
H. Additional results on abstractive text summarization
In this section, we report comprehensive evaluation results on summarization tasks for the 7B parameter models trained on 200B and 500B tokens of natural language from Section 3.7.
This paper is available on arxiv under CC BY 4.0 DEED license.
Authors:
(1) Fabian Gloeckle, FAIR at Meta, CERMICS Ecole des Ponts ParisTech, and contributed equally;
(2) Badr Youbi IdrissiFAIR at Meta, LISN Université Paris-Saclay, and contributed equally;
(3) Baptiste Rozière, FAIR at Meta;
(4) David Lopez-Paz, FAIR at Meta and his the last author;
(5) Gabriel Synnaeve, FAIR at Meta and the last author.