
Table of Links
B. CriticBench: Sources of Queries
C. CriticBench: Data Generation Details
D. CriticBench: Data Selection Details
E. CriticBench: Statistics and Examples
3.2 DATA SELECTION
Many existing evaluation benchmarks for large language models suffer from insufficient differentiability, i.e., both stronger and weaker models yield similar performance (Fu, 2023). This issue likely arises from the presence of either overly simple or exceedingly difficult examples in the benchmarks. Such examples are less valuable for evaluation and can undermine the utility of the benchmarks when average scores are calculated, leading to indistinguishable outcomes. To address the issue, we introduce various filtering strategies aimed at selecting high-quality and differentiable examples.
3.2.1 HIGH-QUALITY RESPONSE SELECTION
Initially, we can narrow the example set from 780K to 15K by sampling one correct and one incorrect response for each query and generator. While random uniform sampling is the the most straightforward strategy, it risks including examples with obvious errors, which offer little evaluative value. To mitigate this, for the incorrect responses we focus on sampling convincing wrong-answers (Lightman et al., 2023) that are more likely to fool the models. In cases suitable for majority voting, we identify the most frequent incorrect answer for each query, and then sample from responses containing this answer. For coding tasks where majority voting is not applicable, we sample from responses that pass the most unit tests, indicating that it is mostly correct but fails in certain corner cases.
To further enhance data quality, we employ the complexity-based sample selection strategy (Fu et al., 2023b) for tasks that require chain-of-thought reasoning. Specifically, we opt for responses that involve more reasoning steps, as this is positively correlated with higher accuracy (Fu et al., 2023b). This approach is beneficial for sampling both types of responses. For correct ones, it minimizes the likelihood of false positives; for incorrect ones, it yields more convincing responses that pose greater challenges in flaw detection for weaker models.
Lastly, as many tasks are challenging and may require emergent abilities (Wei et al., 2022a) to perform well, smaller models generally underperform and produce lower-quality responses compared to larger ones. We include data from these smaller models only for analyzing self-critique abilities; they are excluded from the final evaluation benchmarks.
3.2.2 CERTAINTY-BASED QUERY SELECTION
Thus far, our focus has been on choosing responses with higher quality and likelihood of accuracy. We now shift our focus to the quality of queries. Not all queries are equally valuable: trivial queries that models easily answer correctly are generally less valuable, whereas queries consistently answered incorrectly may either be too complex for LLMs or suffer from wrong “golden” labels.
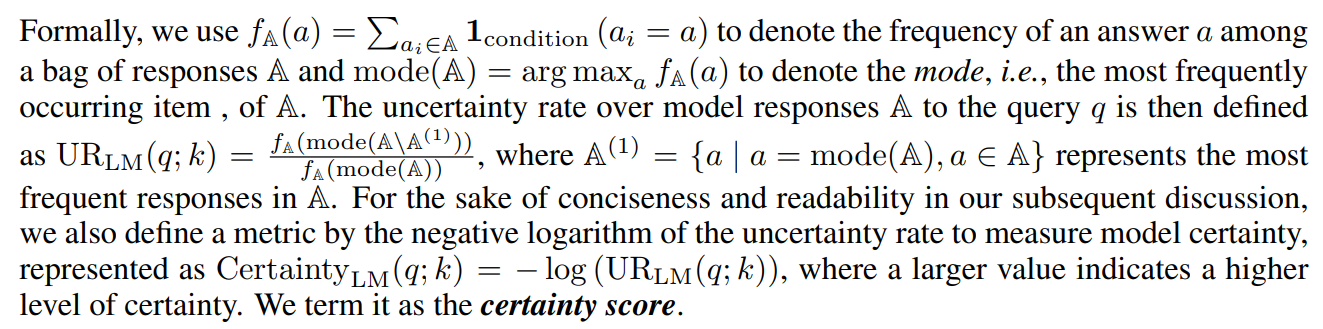
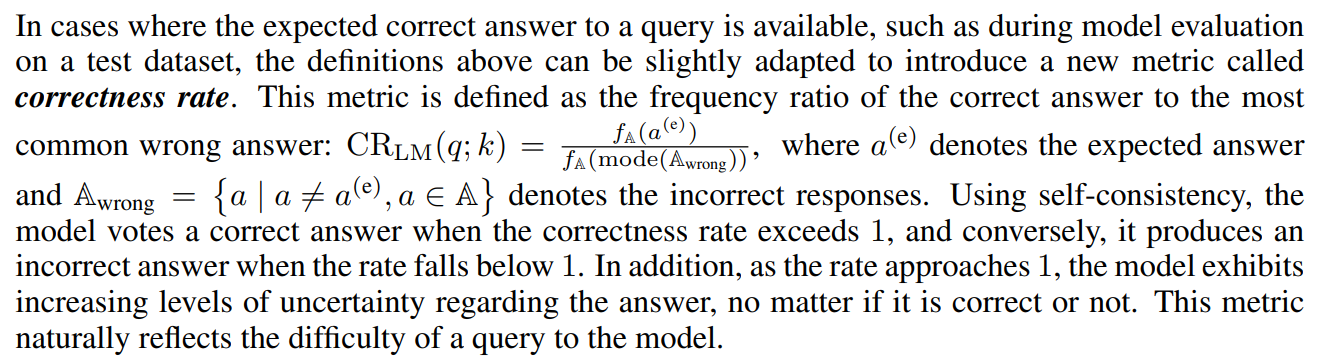
To minimize the presence of such queries in our benchmark, we introduce two metrics to quantify the levels of certainty when models answer a query: the certainty score and correctness rate. We will use these metrics to help us select queries of moderate difficulty.
The metrics draw inspiration from the majority voting mechanism in the self-consistency approach (Wang et al., 2023), which functions by generating multiple candidate outputs for a query, and then aggregating them using a majority voting procedure to select the most commonly occurring answer. Observing that different majority votes, even those resulting in the same outcome, can indicate vastly different levels of certainty. To illustrate, consider a voting situation with 100 candidates where: (i) all candidates are x; and (ii) 51 candidates are x and 49 are y. Although both situations result in a majority vote for x, the level of certainty varies significantly: the former situation denotes a high degree of confidence, whereas the latter reflects a considerable level of uncertainty.
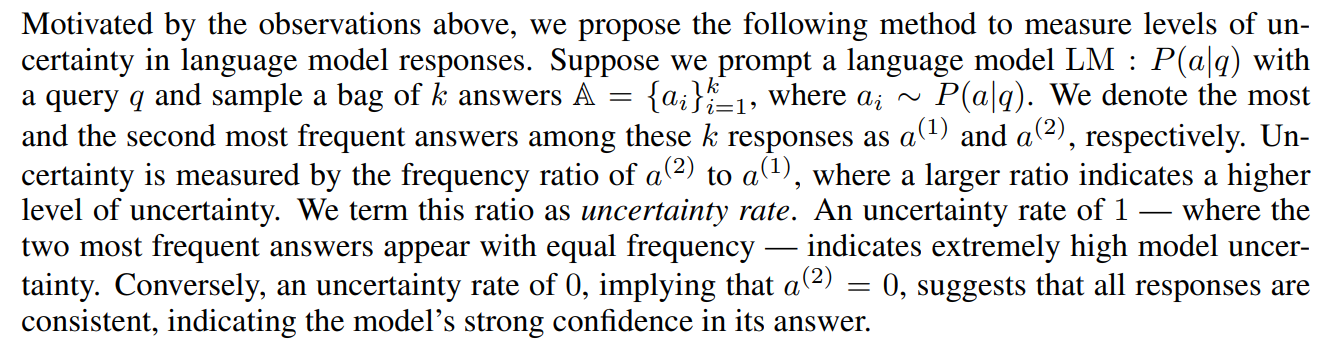
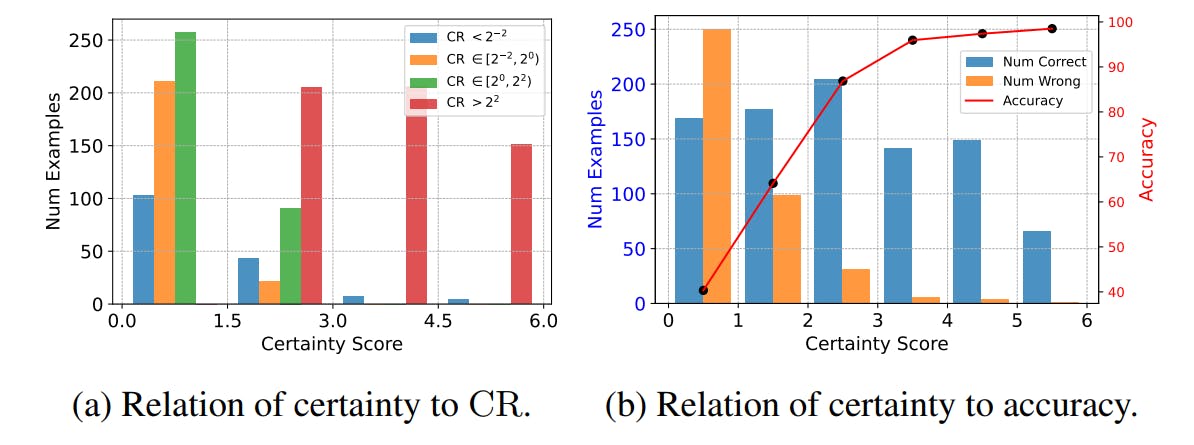
We present a simple case study to intuitively demonstrate the properties of our proposed metrics. We evaluate PaLM-2-S (Google et al., 2023) on GSM8K (Cobbe et al., 2021) using a 64-path self-consistency. The relationship between model certainty, correctness rate (CR), and model accuracy is depicted in Figure 2.
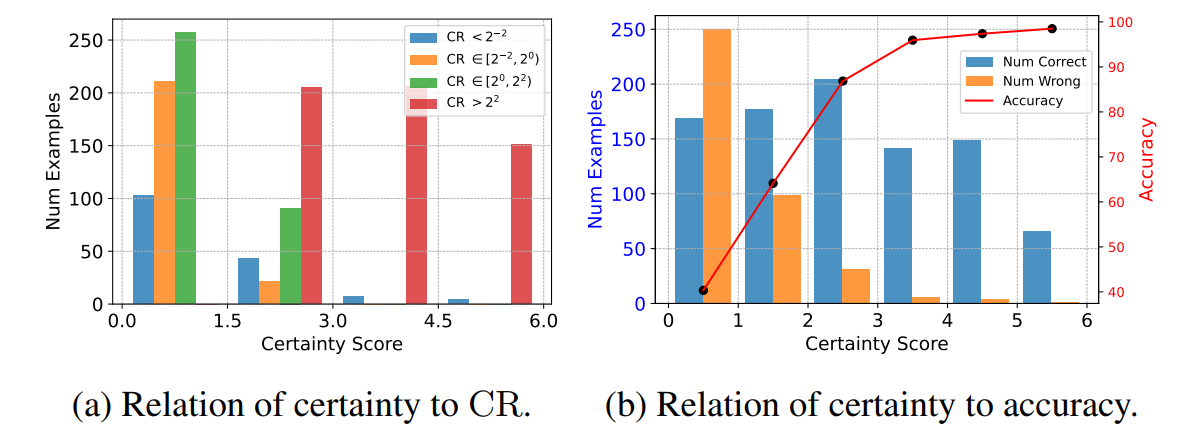
Figure 2a displays the correlation between model certainty and correctness rate (CR). Test examples with lower CR present greater challenges to models. As evidenced in the figure, lower certainty correlates with more low-CR examples, leading to more incorrect predictions. As certainty increases, the instances of low CR diminish, resulting in higher accuracy. Figure 2b illustrates the correlation between model certainty and accuracy in a more straightforward way. As the certainty level rises, the proportion of incorrect predictions markedly decreases, signifying increased accuracy.
We now adopt a certainty-based sample selection strategy. We calculate the correctness rate for each query, selecting those with a CR close to 1. This suggests that models exhibit considerable hesitation and uncertainty when responding to these queries, indicating a moderate level of difficulty that is neither excessively simple (CR → +∞) nor overly challenging (CR → 0). For coding tasks, where certainty metrics cannot be computed, we use the ratio of correct to incorrect answers as a surrogate for CR. Moreover, due to the limited size of HumanEval, we only exclude the simpler queries with a CR > 1, and retain the challenging examples. We will analyze the correlation between critique ability and model certainty for queries in Section 4.3.
Detailed implementation of each stage in data selection can be found in Appendix D.
Final Data Formulation To this end, we could further narrow the benchmark dataset to 3K high-quality, differentiable examples, with 1K for each original dataset. The resulting subsets are named as Critic-GSM8K, Critic-HumanEval, and Critic-TruthfulQA, and their mixture is referred to as CRITICBENCH. We provide the data statistics and examples in Appendix E. As our data collection method is scalable and generalizable across tasks, we view the construction of CRITICBENCH as a continuous effort. This paper serves as an initial step, presenting three representative datasets. We hope to extend the mixture to cover more tasks and scenarios in future work.
Authors:
(1) Liangchen Luo, Google Research ([email protected]);
(2) Zi Lin, UC San Diego;
(3) Yinxiao Liu, Google Research;
(4) Yun Zhu, Google Research;
(5) Jingbo Shang, UC San Diego;
(6) Lei Meng, Google Research ([email protected]).
This paper is