
Table of Links
-
2.2 An anedotal model from industry
-
A Model for Commercial Operations Based on a Single Transaction
-
Modelling of a Binary Classification Problem
2.3 Choice of Costs in the Model
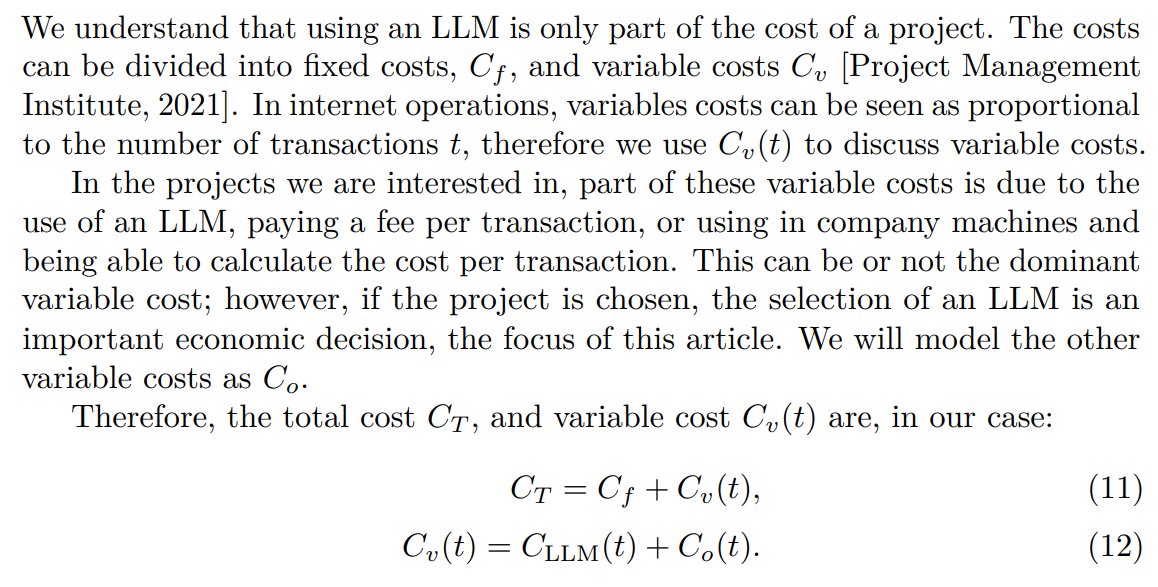
Moreover, since in this article we are interested in the operational costs of using LLMs, we suppose a company that is already operating its business and already decided to use LLMs in parts of its operations; however, it did not decide yet which LLM to use, due to the difference in LLM costs and performance. We also suppose that, for most enterprises, operational costs will be greater than development costs, which are considered fixed costs. Also, since the development costs are mostly similar for all LLMs, this is also a point that will not help the LLM choice.
Therefore, our premise is that we only need to analyze on CLLM(t), with all other costs considered equal for the same application, according to the principle “ceteris paribus”
The cost per token value, C, is usually very small and is charged by thousands or millions of tokens. According to OpenAI, one can “think of tokens as pieces of words, where 1,000 tokens is about 750 words”. OpenAI also charges tokens in the input cheaper than tokens in its output [OpenAI, 2024].
For example, for 1,000,000 tokens, the OpenAI prices in May 2024 for tokens in the input were US$ 5.00 for gpt-4o and 0.50 for gpt-3.5-turbo-0125. Output tokens are usually three times more expensive. The most expensive OpenAI models charged US$10 for input token and US$30 for output tokens [OpenAI, 2024].
2.3.1 Are there other costs?
A more complete analysis should use the impact of other costs, even if they are the same, to better visualize the real impacts on the business. The following is a consideration of other costs.
• Network costs: many cloud billing models include network costs, with different costs for using the service’s internal network and using the external network. This may influence the choice of a service provided by the alreadycontracted cloud provider. Since there is a relation between transaction size and network costs, it would not be difficult to bring network costs to our model.
• Embedding costs: If it is necessary to use RAG, or another technique that uses embedding, the cost of RAG may be important. Normally, the RAG cost is completely dominated by the most expensive models, but it is of the same order of magnitude as that of the cheapest models. For example, the embedding ada-v2 has the same cost as the model gpt-2 [OpenAI, 2024]. Embeding costs can be easily added to our model.
• Relationship between input and output: As we have seen, as some models have different costs for input and output, it is possible that, for similar tasks, but with different outputs, the cost-benefit ratio changes. This is no challenge to our models, since it only impacts the calculation of the total cost of one transaction.
• Refining costs: If the option is for a task where periodic refining is required, it may be interesting to consider these costs. This would bring about a more complex model including periodic costs that would actually be fixed costs in the project. • Reinforcement learning strategies: Along with refinement, reinforcement and learning strategies can have direct effects on cost. This would bring new variables to the model since those strategies would be classified as variable cost.
• Discounts and “free” machines: it is possible that some LLMs provide discounts when transactions are bought in advance or in a large quantity, and it is also possible that available machines are underused and using them will actually lower the average price per transaction. This would bring about a more complex modeling of the cost per transaction.
In addition, there are other nonfinancial issues to take into account that affect the return, such as response time, i.e. latency, which can lead to a result, in practice, worse than the theoretical one, because a model that takes longer than expected by a user can lose the opportunity to present its results, because the user gives up navigation, generating a lower success rate, in practice, than expected.
2.4 Why multiple scenarios
In this paper, we choose to create different models for some different scenarios.
Each company and even each project in a company’s portfolio may have different data for its managers to analyze and predict the outcome of a project.
For example, in certain projects the gain can be calculated per operation. For example, a recommendation system that recommends a single item for purchase in the last step of a sale can be built based on the premise that it will increase the ticket in US$ 10 in 10% of the cases, but it will also lose the complete sale transaction, due to missing the user’s focus on the sale, in 1% of the cases. A system that avoids toxicity in a game can be created on the premise that it will reduce churn by 5 percentage points. Although the first example deals with the problem based on the cost of an operation, the second can only be seen from a global scenario of the company, as each transaction will not directly influence the churn rate, but rather the global change in the spirit of in-game conversations that indirectly attracts or repels clients.
Authors:
(1) Geraldo Xexéo, Programa de Engenharia de Sistemas e Computação – COPPE, Universidade Federal do Rio de Janeiro, Brasil;
(2) Filipe Braida, Departamento de Ciência da Computação, Universidade Federal Rural do Rio de Janeiro;
(3) Marcus Parreiras, Programa de Engenharia de Sistemas e Computação – COPPE, Universidade Federal do Rio de Janeiro, Brasil and Coordenadoria de Engenharia de Produção - COENP, CEFET/RJ, Unidade Nova Iguaçu;
(4) Paulo Xavier, Programa de Engenharia de Sistemas e Computação – COPPE, Universidade Federal do Rio de Janeiro, Brasil.
This paper is